Company Admin
Analytics - what you can see
Analytics is the company-wide reporting surface in CERQA. It has two tabs. Overview shows four company-wide cards over a 7- or 30-day window. Companies & Members carries a Properties view (storage and usage per property) and a Members view (member counts, engagement and roles). This page is the reference for what each view shows and who can see it.
Analytics is a sidebar page, not a property tab
A common misconception: Analytics is sometimes assumed to be a per-property tab alongside Model, Files, Vision, etc. It is not. Analytics lives in the main sidebar on the left of CERQA, alongside Properties and the other company-level entries. It shows company-wide roll-ups across every property your company has access to, not a single property at a time.
Opening Analytics from the sidebar
Find the Analytics entry in the main sidebar on the left. Click it to open the Analytics page; the workspace replaces the property list with the Analytics Dashboard, starting on Overview by default.
Who can see Analytics
The Analytics sidebar entry is visible to Company Admin and Project Admin. Project Manager, Contributor, Viewer, and Guest do not see the Analytics entry in the sidebar. For the complete role matrix, see F-04 - Roles and permissions. Analytics is one of CERQA's modules, granted to your company at the company level; once granted, the sidebar entry is further gated by role (as above). See CA-07 - Module gating reference for the full module catalog and how grants work.
The Overview tab
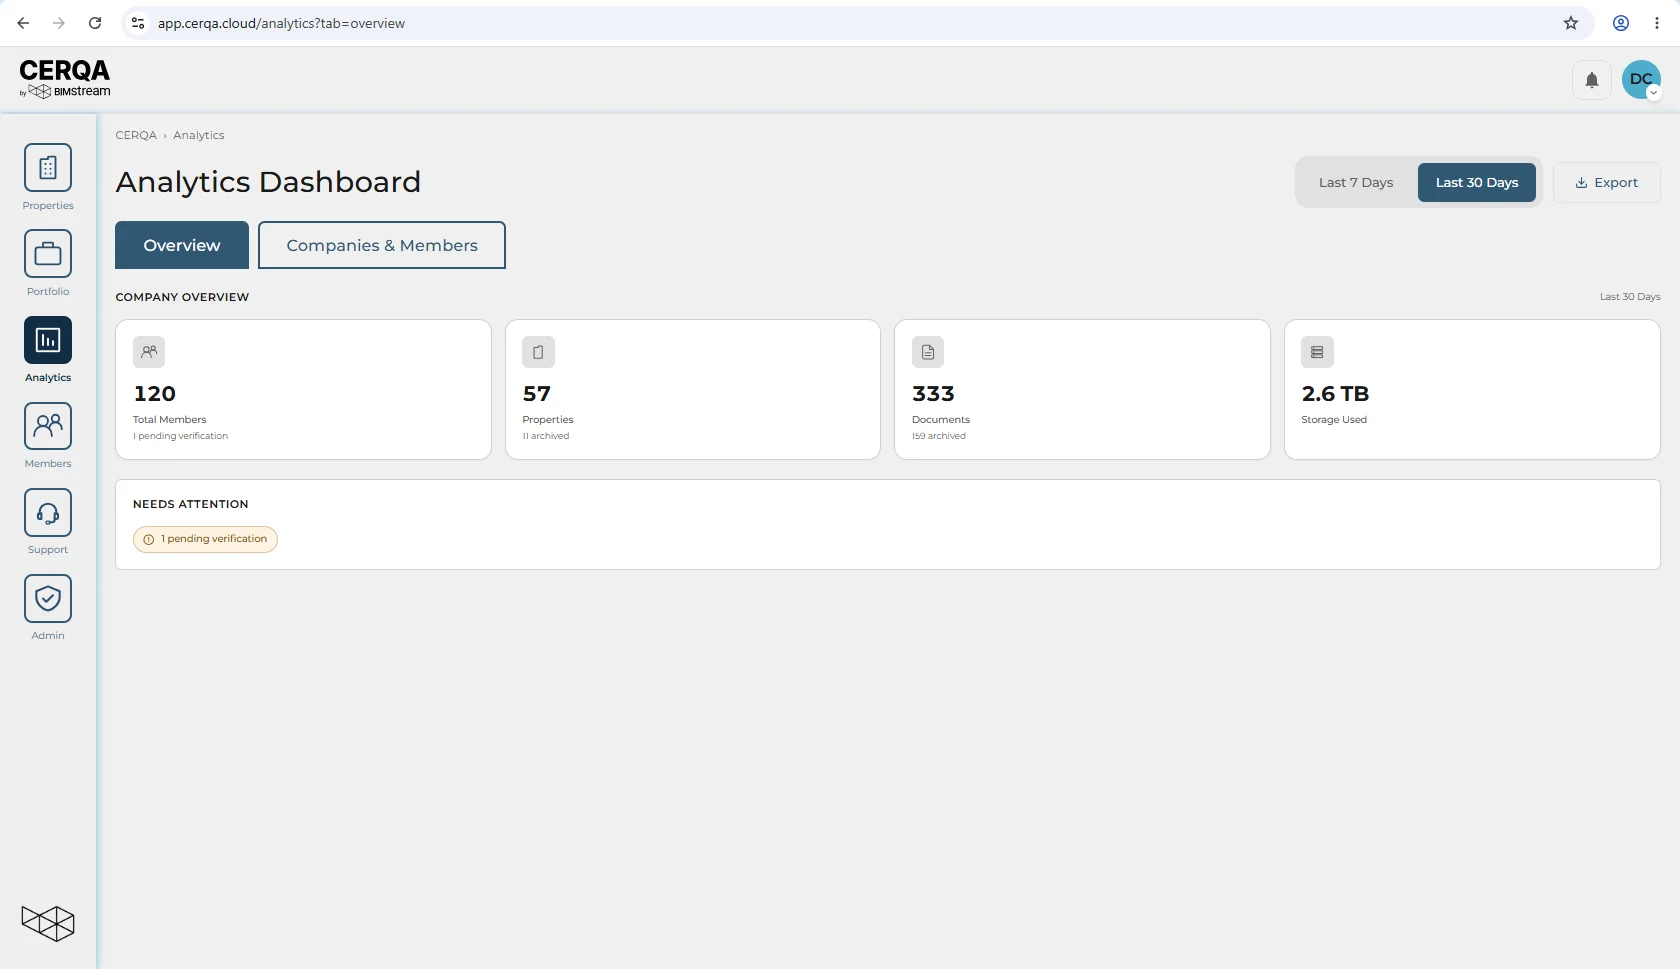
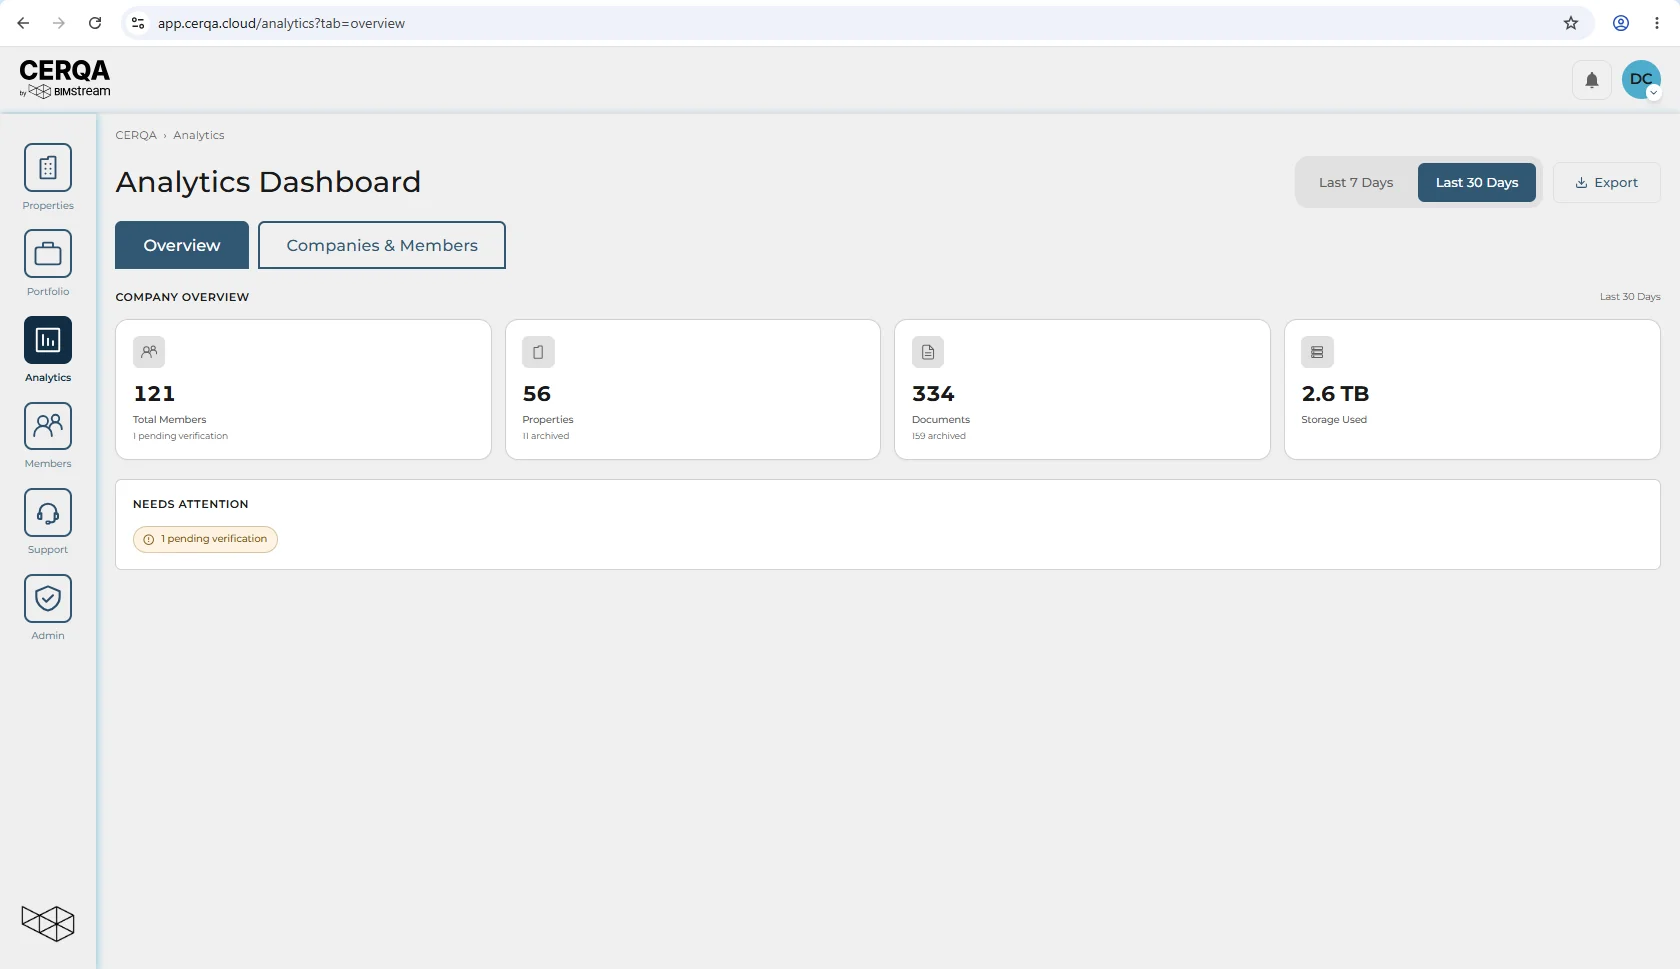
Overview is the default tab and the highest-level view in Analytics. Its Company Overview row holds four cards: Total Members (with how many are pending verification), Properties(with how many are archived), Documents(with how many are archived) and Storage Used. Below the cards, a Needs Attention strip lists anything waiting on you, such as a pending verification. That is the whole tab; there is nothing further down.
Top-right, a two-button toggle sets the window the cards cover: Last 7 Days or Last 30 Days. It is the only time-range control in Analytics; the Companies & Members views have none. An Export button sits beside it, and appears on every Analytics view.
Companies & Members: the Properties view
The second tab, Companies & Members, opens on a Properties | Members toggle with Properties selected. A note under the toggle says when the statistics were last recalculated.
The Properties view stacks three things. A row of five cards: Total Properties, Documents, Vision Models, Field Pins and Total Storage. Then Storage Distribution, a donut splitting total storage between Files, Vision and Field, beside a Resource Summary that repeats the three figures as Document, Vision and Field storage. Then the Property Analytics table, one row per property, with the property's name and address, its company, and its Documents, Vision, Field Data and Storage counts. The table sorts by name and by each of the four counts, and a search box sits above it.
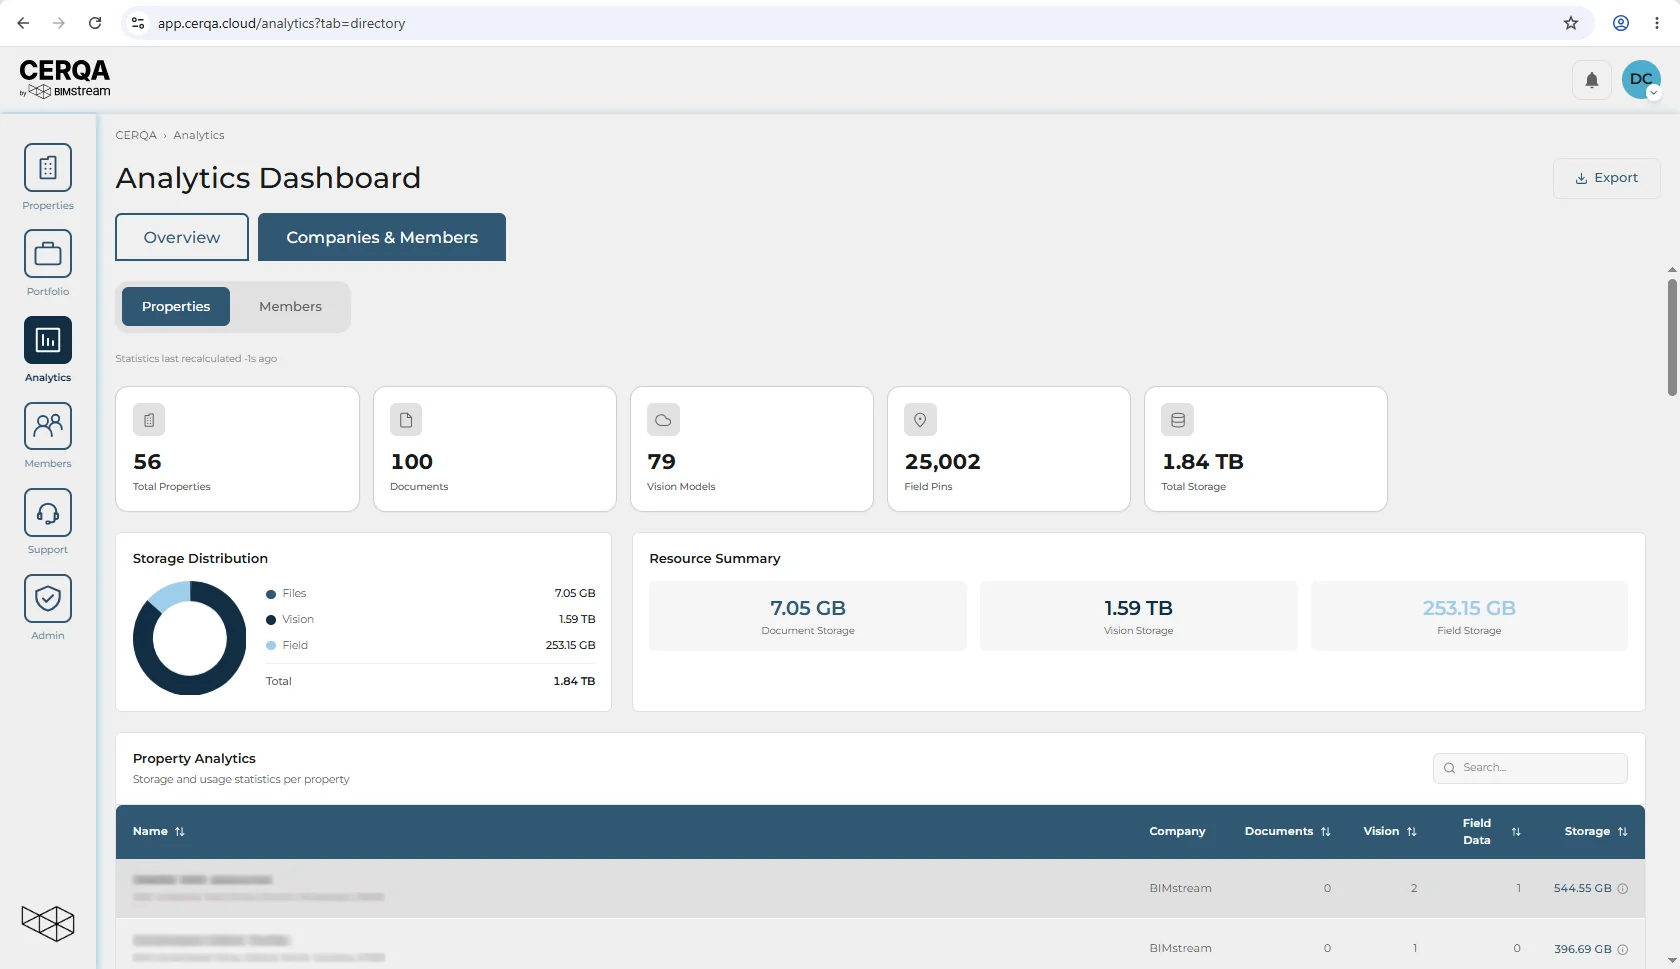
Table rows: no behaviour documented yet
Whether a row in the Property Analytics table opens anything is not documented here. Resting the cursor on a row produces a faint highlight and no pointer, which is not enough to say either way. This page will state the behaviour once the product confirms it.
Companies & Members: the Members view
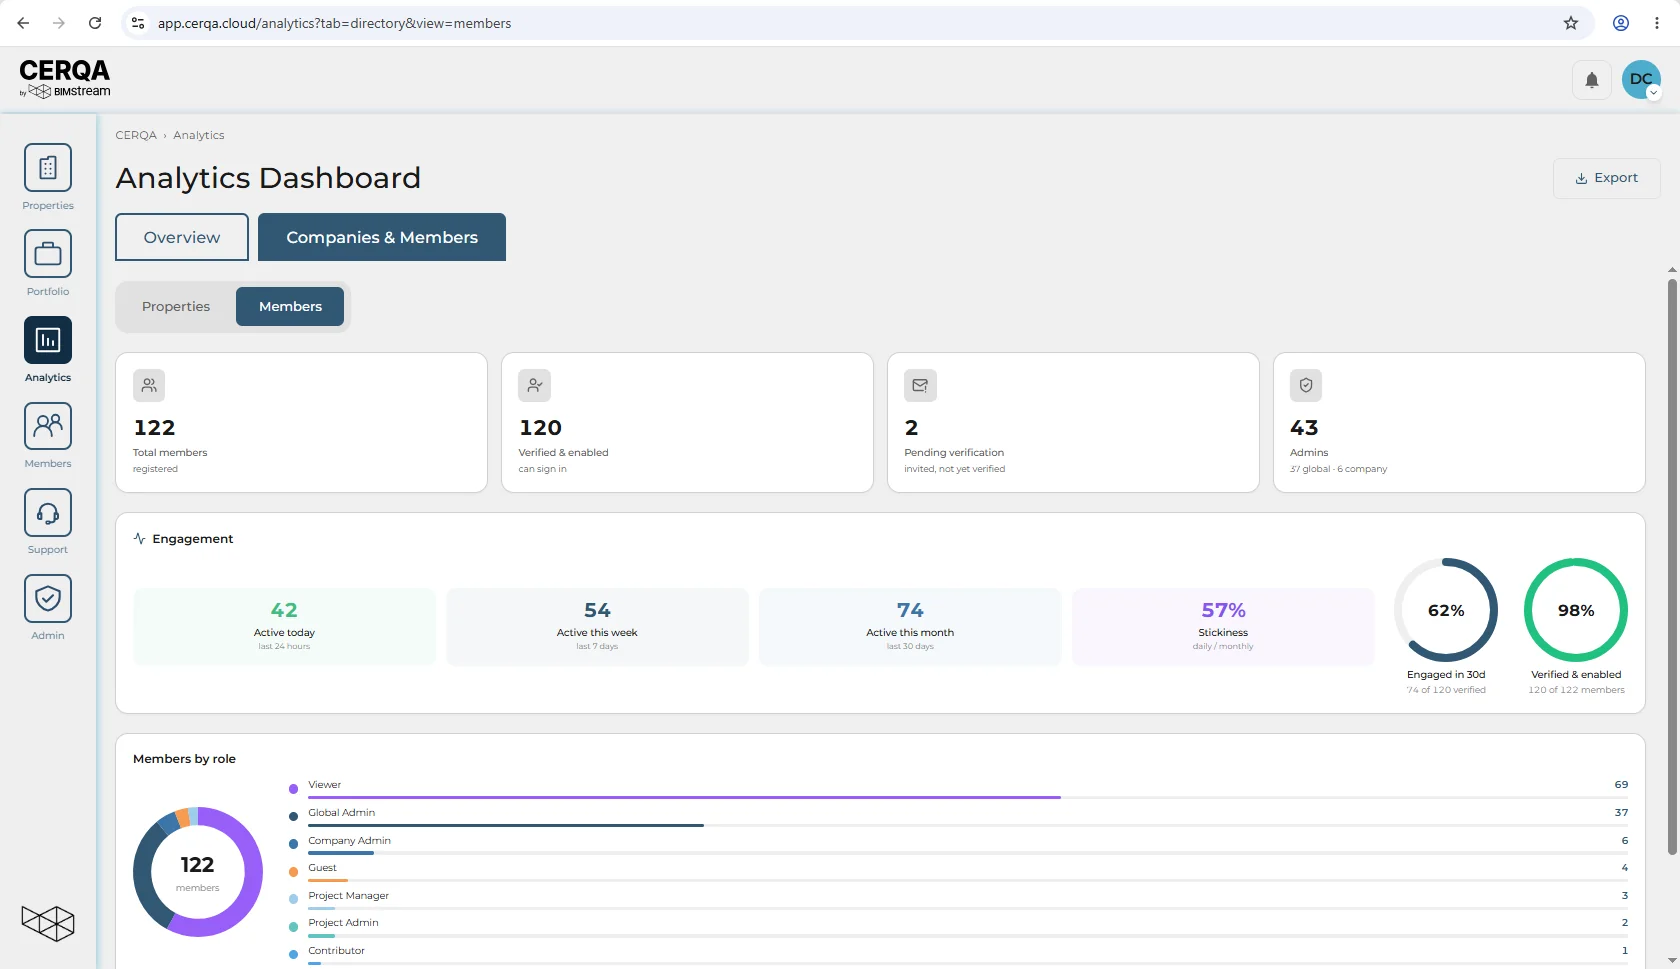
Switch the toggle to Members for the member-side counts. Four cards lead: Total members (registered), Verified & enabled (can sign in), Pending verification (invited, not yet verified) and Admins, split into global and company admins.
An Engagement strip follows: members active today, this week and this month, a Stickiness percentage (daily over monthly), and two rings: Engaged in 30d as a share of verified members, and Verified & enabled as a share of all members. Below it, Members by role charts the count of members holding each role, from Viewer through Global Admin, Company Admin, Guest, Project Manager, Project Admin and Contributor. The view has no time-range control; the window labels on the Engagement strip are fixed.
Related pieces
- F-04 - Roles and permissions - the complete role matrix. Analytics is visible to Company Admin and Project Admin (Project Manager and below do not see the sidebar entry).
- CA-07 - Module gating reference - the module catalog. Analytics is granted at the company level like any other module; once granted, each module is granted per member via the Module Access checkbox. Where Analytics differs: it gates this company-wide sidebar page, not a property tab.
- CA-02 - Logging in and your sidebar - the broader sidebar reference. Analytics is one entry; CA-02 covers the rest of the sidebar structure for Company Admins.